Weekly outline
-
-
Course Description:
This course provides an introduction to the fundamental concepts of probability and statistics, designed for students with no prior background in the subject. Topics include data analysis, fundamental probability rules, random variables, probability distributions. The course emphasizes problem-solving and interpretation of statistical findings.
Topics:
Topic One: Describing Data with Graphs
- Variables and Data.
- Types of Variables.
- Graphs of Categorical Data.
- Graphs of Quantitative Variables.
- Relative Frequency Histograms.
Topic Two: Describing Data with Numerical Measures
- Describing a Set of Data with Numerical Measures.
- Measures of Center.
- Measures of Variability.
- On the Practical Significance of the Standard Deviation.
- A Check on the Calculation of s.
- Measures of Relative Standing.
- The Five-Number Summary and the Box Plot.
Topic Three: Describing Bivariate Data
- Bivariate Data.
- Graphs for Qualitative variable.
- Scatterplot for Two Quantitative Variables.
- Numerical Measures for Quantitative Bivariate Data.
Topic Four: Probability and Probability Distributions
- Events and the Sample Space.
- Calculating Probabilities Using Simple Events.
- Event Relations and Probability Rules.
- Independence, Conditional Probability, and the Multiplication Rule.
- Discrete Random Variables, Their Probability Distributions.
Topic Five: Several Useful Discrete Distributions
- The Binomial Probability Distribution.
- The Poisson Probability Distribution.
Topic Six: The Normal Probability Distribution
- Probability Distributions for Continuous Random Variables.
- The Normal Probability Distribution.
- Tabulated Areas of the Normal Probability Distribution.
-
-
-
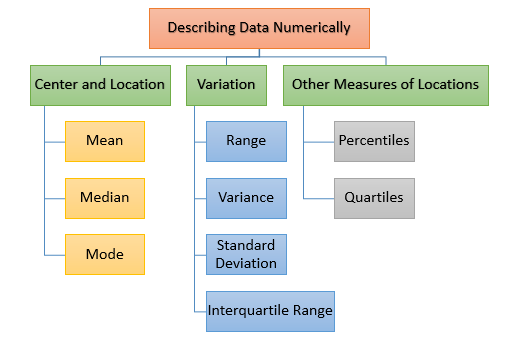
Topic (2): Describing Data with Numerical Measures
Overview:
- Measures of central tendency (mean, median, mode).
- Measures of variability (range, variance, standard deviation).
- Measures of relative standing.
- Five number summary.
-
Topic (2): Describing Data with Numerical Measures
1 Describing a Set of Data with Numerical Measures.
2 Measures of Center.3 Measures of Variability. 4 On the Practical Significance of the Standard Deviation.
5 A Check on the Calculation of s.6 Measures of Relative Standing.
7 The Five-Number Summary and the Box Plot.
-
